Step 23: Debugging
Let's look at a "bug" in our application: make a few notes with the same title, and then open one of them!
.gif)
Notice when you open one of those notes, all of them are openned!
Exercise Take a moment and try to "debug" the app!
Solution
Update components/Note.jsx as follows:
  function Note(props) {
    const { note, remove } = props;

    return (
-     <Accordion.Item value={note.title}>
+     <Accordion.Item value={note.id}>
        <NoteControl note={note} remove={remove} />
        <Accordion.Panel>{note.text}</Accordion.Panel>
      </Accordion.Item>
    );
  }
Can you explain why this change fixes the issue?
This application is small enough for you to debug it by tracing the code. Here are two tools that can help debugging larger applications.
React Developer Tools
React Developer Tools is a browser extension that adds React debugging tools to the Chrome Developer Tools.
Open Chrome developer tools. Notice there are two new tabs: Components and Profiler. You can use these tabs to navigate through the React components (viewing their props, state, etc.) or profile the performance of your application.
.gif)
To learn more about this, I recommend reading How to use the React Developer Tools.
The debug package
Debug is a tiny JavaScript debugging utility that works in Node.js and web browsers.
You can add it to your application by:
yarn add debug
Next, let's add debug to one of the components as an example. We update pages/Home.jsx.
+ import Debug from "debug";

+ const debug = new Debug("quicknotes:pages:Home.jsx");

  function Home(props) {
    const { notes, query, setQuery, add, remove } = props;

+   useEffect(() => {
+     debug("Home page is loaded!");
+   }, []);

    return (
      <Container>
        <Header query={query} setQuery={setQuery} add={add} />
        <Notes notes={notes} query={query} remove={remove} />
      </Container>
    );
  }
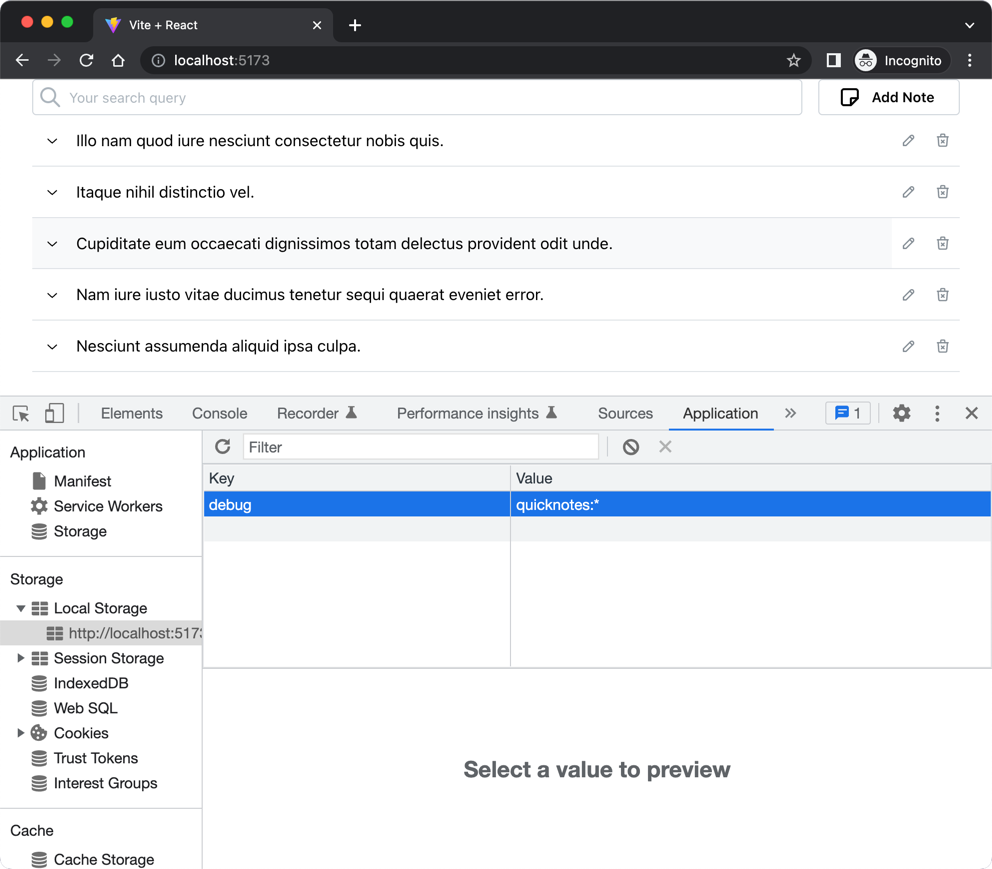
Next, open developer tools and add the following in local storage:

Notice how the debug message is printed to the console.
.gif)
We will talk more about using this package, in particular using "namespaces" to hone in or zoom out in your application.